What is three-dimensional acoustic CT imaging of foundation piles?
Principle of 3D Acoustic CT Data Acquisition for Foundation Piles
The on-site operation of foundation pile acoustic CT is generally to place the probe into the prefabricated sonic logging tube of the foundation pile, pull the cable from bottom to top or from top to bottom (the general operation is convenient to lift from bottom to top), the foundation pile sonic logging CT instrument Acoustic fluoroscopy CT is automatically performed according to the acoustic probe in the measuring tube.
There may be 2 acoustic tubes, 3 acoustic tubes, 4 acoustic tubes, etc. buried in a foundation pile. If there are more than 4 acoustic measuring tubes, a combination of 4 acoustic measuring tubes can be used to repeat the observation.
As shown below:
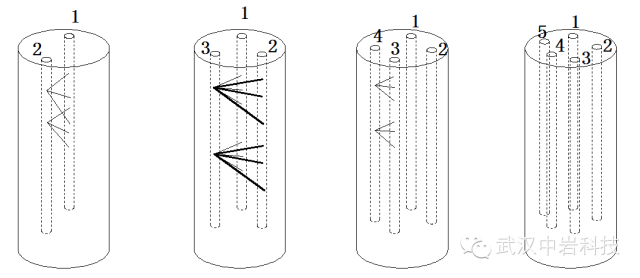
Schematic diagram of foundation pile acoustic CT and acoustic measuring tube
Generally, the acoustic tube number in the north direction is 1, and then numbered in sequence.
The diameter of the acoustic tube is about 0.05 m (that is, 5 cm) when performing acoustic CT testing of foundation piles. In the field, when collecting sound data with pile sonic logging CT, the distance between the outer edges of the two sound measuring tubes is measured, as shown in the figure below.
It can be seen from the figure that the distance between the two acoustic measuring tubes measured in the field differs from the actual distance between the centers of the two acoustic measuring tubes by one acoustic measuring tube diameter.
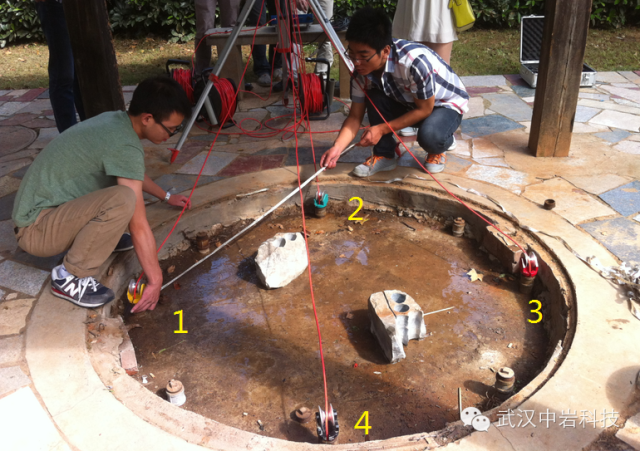
Photo of on-site measurement of the distance along the outer edge of the acoustic tube.
Analysis of advantages and disadvantages of traditional sonic logging test method for foundation piles
As shown in the figure below, it is a schematic diagram of the traditional sonic logging test method of foundation piles. It can be seen from the figure that every two acoustic tubes can form a profile. The traditional method is that there is only one probe in each measuring tube, and the same as the other tube. One probe transmits sonic waves, and the other probe receives it.
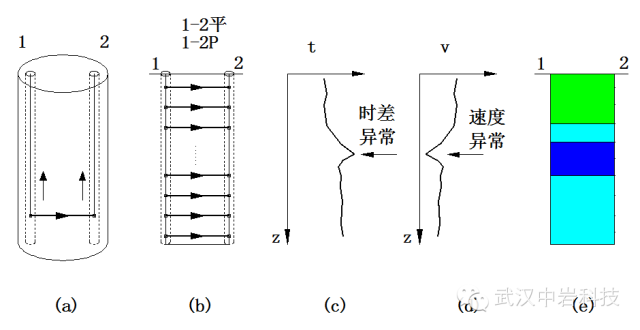
Schematic diagram of traditional foundation pile acoustic wave transmission test method
Generally speaking, in the field test, the heights of the sonic probes of the two measuring tubes are adjusted to be the same, and then the two probes are pulled up in parallel to collect sonic data.
The advantage of this acquisition method is that it is convenient and fast. The ray path is shown in Figure (b). It can be seen from the figure that the ray path is horizontal. By extracting the first arrival time (time difference) of the transmitted sound wave between the two probes, a curve of the sound wave time difference with depth can be drawn, as shown in Figure (c). The place where the sonic time difference is too large is the time difference. Since the distance between the two sound measuring tubes is basically the same (both sound measuring tubes are parallel), the speed of the sound wave between the two probes can also draw a curve of speed with depth, as shown in (d ), the lower speed position generally corresponds to the position of the defect. If the speed is drawn as a color scale diagram, as shown in (e), then the depth distribution and depth range of defects in the foundation pile can be analyzed intuitively.
Similarly, it is possible to draw a curve of amplitude with depth, and according to the amplitude curve, it can also assist in analyzing the horizontal position of the defect.
Since this test method does not require complex mathematical operations or inversion, the test speed is fast and imaging can be performed in real time. The advantage of this acoustic test method for foundation piles is that the depth position of the defect is more accurate.
The disadvantage of this test method is that it cannot give a horizontal distribution of defects.
In order to detect the horizontal distribution of defects, it is necessary to improve the traditional method, increase the tilt test, and use the inversion method to locate the defects.
Brief introduction of traditional acoustic CT method
In order to accurately locate the position of the defect in the foundation pile, the traditional acoustic wave CT detection method can be used, as shown in the following figure.The method of acquiring data by sonic CT is to keep one probe stationary firstly, for example to keep the transmitting probe stationary, and then pull up the cable of the receiving probe. The ray path is shown in (a). Next, move the transmitting probe up one position, and then pull the receiving cable up from the bottom of the pile to the top of the pile. The ray path is shown in Figure (b), and so on. The launch probe is pulled from the bottom of the pile to the top of the pile. The complete ray path obtained is shown in (c). Inversion imaging of the time difference of all rays (usually using ART/SIRT or other methods), the distribution of acoustic wave velocity can be obtained as shown in figure (d). The depth distribution and horizontal distribution of defects can be intuitively given from the graph.
The advantage of this traditional acoustic CT method is that it has many test data and imaging accuracy.
The disadvantages of this method are also obvious. The outstanding shortcoming is that the field collection speed is slow. A CT profile needs to repeatedly pull the probes of different acoustic tubes, and the field collection takes a long time. If there are multiple acoustic tubes and multiple CT sections in a foundation pile, it needs to be acquired longer. In addition, this collection method has a large amount of data, a large-memory computer is required for indoor data processing, and the imaging speed is also slow, requiring high performance of the computer. In addition, when the transmitting acoustic wave probe and the receiving acoustic wave probe are far away, the transmitted acoustic wave energy loss is large, and the signal-to-noise ratio of the collected acoustic wave data is reduced, which brings great difficulty to signal analysis such as time difference extraction.
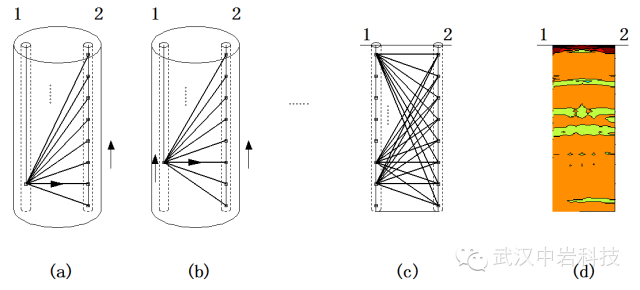
Schematic diagram of traditional acoustic CT detection method
Introduction of improved sonic CT detection method for foundation piles
The traditional acoustic transmission test method for foundation piles is fast, but only the depth distribution of defects can be obtained, and the horizontal distribution of defects cannot be given. The traditional sonic CT method can accurately obtain the depth distribution and horizontal distribution of defects, but the field detection speed is slow, the amount of data is large, and processing is time-consuming. In order to overcome the shortcomings of the above two methods and integrate their advantages, an improved acoustic CT method can be used.
The improved sonic CT detection method of foundation piles is shown in the figure below. It is that there are two sound wave probes on the cable of each sound measuring tube, and these two probes can be used as both transmitting probes and receiving probes. There are 4 ray paths at each depth position, both parallel and oblique rays. It can invert the imaging of the CT section to give the depth and horizontal distribution of the defect. At the same time, its field acquisition method is traditional The sonic logging test method is the same, first put the sound wave probe to the bottom of the foundation pile, then pull the cable at the same time, collect all the data at once, the field test speed is fast.
Figure (a) is the ray path diagram when both cables are at the bottom of the pile, and Figure (b) is the ray path diagram when the two cables are simultaneously pulled to the next position. In the field collection, when the speed of pulling the cable is kept slow and uniform, the pile sonic logging instrument automatically scans and superimposes to enhance the signal-to-noise ratio of the acoustic signal. The ray path diagram of an acoustic CT section is shown in (c), and its imaging effect is shown in (d). Because the relative height difference of the four probes is small, the amplitude attenuation of the transmitted sound wave is small, and the quality of the collected sound wave data is high.
The advantage of this method is that the field acquisition speed is fast, the amount of data is not large, and the imaging speed is relatively fast, which can achieve quasi real-time imaging in the field.
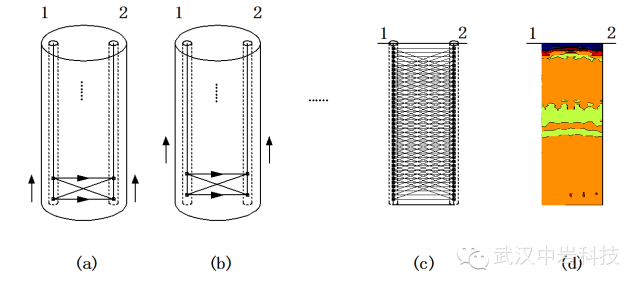
Schematic diagram of improved sonic logging CT detection method for foundation piles
By analyzing the ray path of a CT section, it can be found that it can be decomposed into three ray subsets, as shown in the figure below.
Figure (a) is the total ray path diagram, Figure (b) is the decomposed horizontal ray path diagram, that is, 1-2P ray path, indicating that the depth of probe 1 and probe 2 are the same, and figure (c) is the decomposed tilt The ray path diagram, that is, 1-2X ray path, means 1 high and 2 low, that is, probe 1 is high, and probe 2 is low. Figure (d) is another decomposed ray path diagram, which is 2-1X ray path. Indicates 2 high and 1 low, that is, probe 1 is low and probe 2 is high.
Because there are two acoustic wave probes on each cable, the data of the traditional acoustic wave test method can be directly extracted from the test data of this improved pile acoustic wave CT detection method, which can be given in real time according to the time difference chart of the 1-2P data set Depth distribution of defects. At the same time, the data of 1-2X and 2-1X oblique ray path sets are integrated to give the distribution of the horizontal position of defects in near real time.
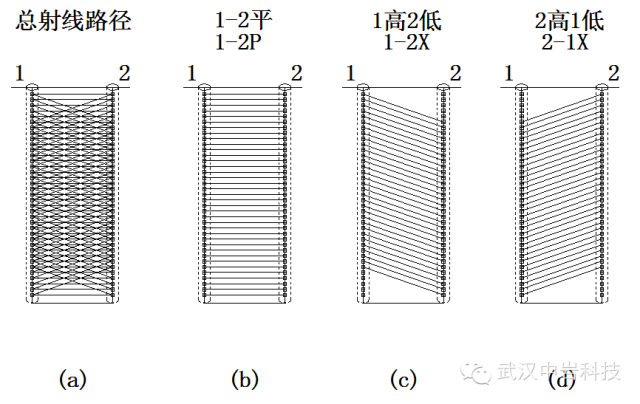
Schematic diagram of ray path decomposition of improved sonic logging CT detection method of foundation pile
Three-dimensional acoustic CT results of foundation piles
The following figure is the three-dimensional imaging map of the acoustic wave CT of the model pile of the Chinese Academy of Sciences. From the graph, the three-dimensional distribution of the abnormal velocity in the foundation pile can be analyzed very intuitively. By extracting the surface of the three-dimensional low-speed anomaly, the three-dimensional distribution of defects in the foundation pile can also be visually seen.
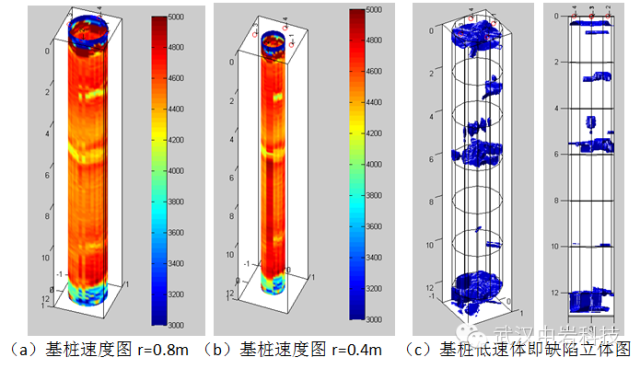
Acoustic CT three-dimensional imaging of model piles of Chinese Academy of Sciences
The CT velocity profile formed by the connection of different acoustic tubes in the foundation pile can also be used to analyze the distribution of the acoustic wave velocity in the foundation pile, and to analyze and identify the distribution range of defects in the foundation pile. The following figure is the acoustic CT imaging of the 1-3 section of the model pile of the Chinese Academy of Sciences. Figure (a) is the error reduction curve of inversion, Figure (b) is the time difference fitting curve, and Figure (c) is the velocity distribution map of CT inversion of 1-3 section. From the figure, the depth of the defect can be clearly seen Distribution and horizontal distribution.
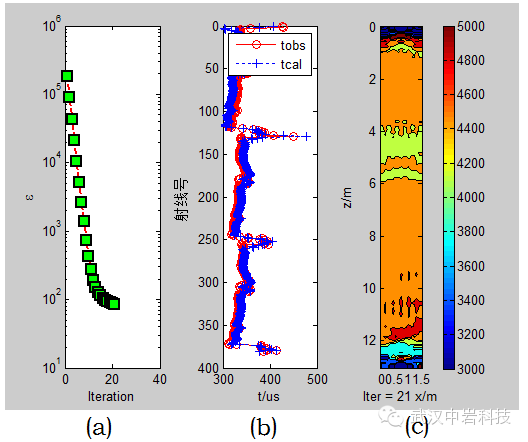
Comprehensive map of acoustic CT inversion of model 1-3 profile of Chinese Academy of Sciences
a. Error decline curve of inversion (b) Time difference fitting curve (c) Velocity distribution of 1-3 section acoustic wave CT inversion.
RSM-SY8 foundation pile ultrasonic CT imaging tester is equipped with foundation pile cross-hole CT inversion and imaging software.
This program is easy to operate, powerful, and friendly interface, mainly in:
Simple operation, powerful function, friendly interface, fast inversion speed, 3D dynamic display of 3D stereogram of foundation pile speed, 3D dynamic display of 3D stereogram of foundation pile defect, 3D image can be dynamically rotated and zoomed, JCT software can display a variety of acoustic CT analysis charts The three-dimensional and three-dimensional images dynamically display the defects of the foundation pile, etc., which is convenient for analyzing the distribution of the foundation pile defects.


